Note: This project was confidential, so I have omitted and changed some details.
Goal
An Internet Service Provider provided its customers with a customizable, interactive web portal intended to add value and increase loyalty. They wanted to measure customer satisfaction with the portal and get feedback to identify improvement opportunities.
Approach
- To get a large enough sample for statistically reliable quantitative measurements, while allowing for some qualitative feedback, I designed an online survey.
- To make the survey feel more satisfying and quicker to complete, I used conditional logic to allow intelligent followup questions based on earlier answers.
- To attract participants, I carefully worded an invitation to be displayed in the portal, to appeal to users’ desire to be heard and get a better experience: “Your Opinion Matters! Help us make [portal name] better.”
- To minimize abandonment of the survey, I stated up front that it should take about 10 minutes.
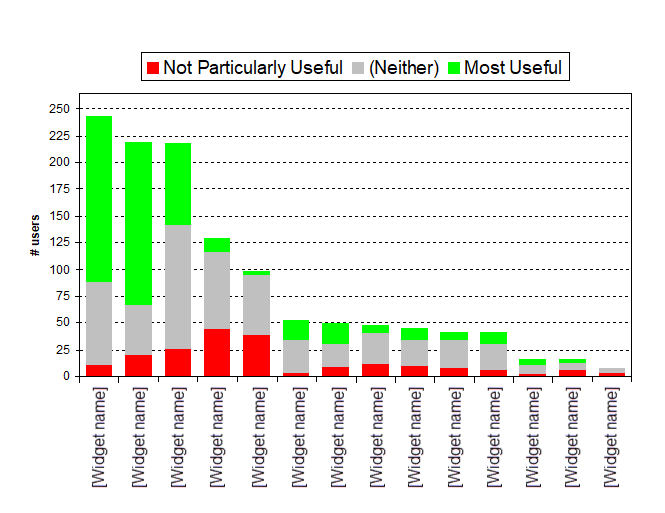
- I started the survey with a few background and general satisfaction questions, then got more specific, asking which portal widgets they used (e.g., news, weather, email, etc.), their feedback about each widget, and how they had customized the layout.
Results
265 responses yielded numerous quantitative and qualitative insights. Overall, 51% liked or strongly liked the portal (with comments illuminating why, such as “everything is all right at your fingertips”, “the quick glance at my e-mails”), whereas about 24% disliked or strongly disliked it (with comments such as “I don’t know how to change ie add to the home page”, “things get changed on my home page and I can’t get them back”).
My analysis uncovered many informative details of widget usage and layout, e.g. that 29% of users had switched from the default 3-column layout, and that an option to have multiple pages of widgets was rarely used as intended, and sometimes caused confusion.
Impact
The ISP gained a baseline measure of user satisfaction and numerous details of how the portal was being used, which widgets and features were driving satisfaction or frustration, etc. This information enabled them to make numerous improvements to the user experience, increasing customer satisfaction and loyalty.
“What I was probably most impressed by was how thorough they were in their research, recommendations, and understanding of the entire customer experience.“
The product manager, commenting on my work with a colleague on a set of projects including this one